PU Prime App
Exclusive deals on mobile


PU Prime App
Exclusive deals on mobile


Nắm giữ thị trường toàn cầu trong tay bạn
Ứng dụng di động giao dịch của chúng tôi tương thích với hầu hết các thiết bị thông minh. Tải xuống Ứng dụng ngay bây giờ và bắt đầu giao dịch với PU Prime trên mọi thiết bị, mọi lúc, mọi nơi.

The U.S. labour market’s vigorous expansion, with the Non-Farm Payroll (NFP) report disclosing an impressive 303,000 job additions that exceeded both previous results and projections, accentuated the U.S. economy’s resilience and amplified concerns over enduring high inflation. Consequently, the Dollar Index (DXY) experienced a resurgence as forecasts about the Federal Reserve’s proclivity for sustaining high-interest rates for a prolonged duration gained traction. This economic buoyancy was mirrored in the U.S. stock market, with all major indexes marking advances at Friday’s close.
Globally, financial markets are now setting their sights on New Zealand, where the Reserve Bank of New Zealand (RBNZ) is slated to make its interest rate decision on Wednesday. The prevailing market sentiment suggests that the RBNZ will hold the official cash rate steady at 5.5%, tempering earlier speculations of a potential rate decrease.
In the realm of commodities, gold reached a new peak before witnessing a pullback amid a reduction in Middle Eastern geopolitical tensions. Meanwhile, the onset of the week saw oil prices dropping more than 1% following news of an Israeli military downsizing in the Gaza Strip, indicating a partial troop withdrawal.
Current rate hike bets on 1st May Fed interest rate decision:
Source: CME Fedwatch Tool
0 bps (85.5%) VS -25 bps (14.5%)

(MT4 System Time)
N/A
Source: MQL5

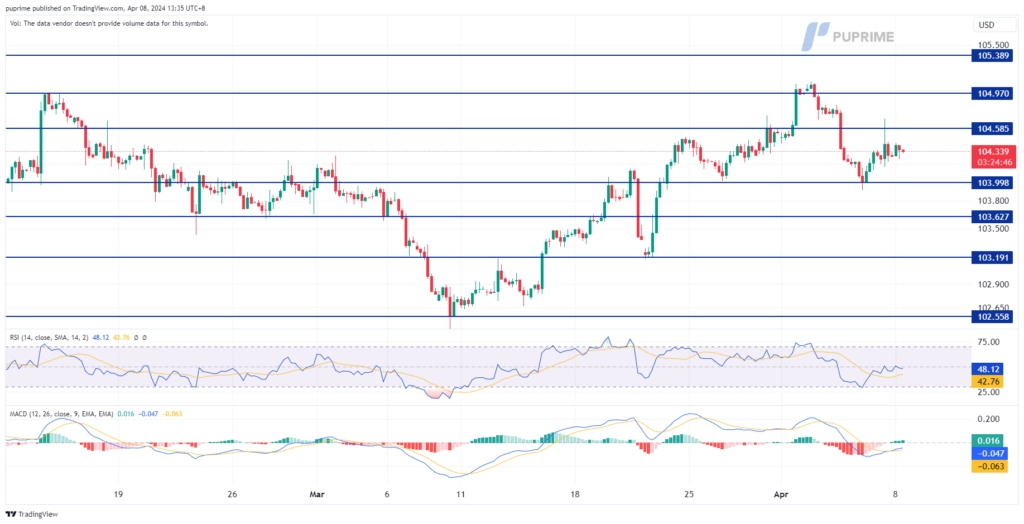
The Dollar Index exhibited robust bullish momentum, buoyed by an impressive US Nonfarm Payrolls report released by the Bureau of Labor Statistics. Nonfarm Payrolls exceeded expectations, soaring to 303K from the previous 270K, far surpassing projections of 212K. Concurrently, the US Unemployment Rate posted a favourable figure of 3.80%, beating forecasts of 3.90%. Consequently, market sentiment swiftly shifted, with the CME FedWatch Tool signalling diminished expectations of rate cuts in June, plummeting to 54.5%. This newfound confidence in the US economy propelled demand for the greenback, further bolstered by a surge in US Treasury yields.
The Dollar Index is trading higher following the prior rebound from the support level. MACD has illustrated increasing bullish momentum, while RSI is at 51, suggesting the index ight extend its gains since the RSI rebounded sharply from oversold territory.
Resistance level: 104.60, 104.95
Support level:104.00, 103.65
Gold prices experienced a notable retreat as investors reallocated their portfolios towards the US Dollar following the upbeat jobs report, which dampened expectations of Federal Reserve rate cuts. The strengthened dollar eroded the appeal of the precious metal, exerting downward pressure on prices. Despite this, lingering uncertainties prompted some investors to seek refuge in gold, mitigating losses. Attention now turns to the upcoming release of March’s consumer price inflation figures, with analysts anticipating a modest decrease in core inflation to 3.70% year-over-year.
Gold prices are trading lower while currently testing the support level. MACD has illustrated increasing bearish momentum, while RSI is at 51, suggesting the commodity might extend its losses after breakout since the RSI retreated sharply from overbought territory.
Resistance level: 2325.00, 2350.00
Support level: 230500, 2295.00
The GBP/USD pair encountered significant downward pressure last Friday following the release of the highly anticipated U.S. Non-Farm Payroll (NFP) data. The report revealed job figures that surpassed market expectations, signalling a robust labour market in the U.S. Despite this, the British pound managed to hold its ground against the strengthening dollar, finding support above the key psychological level at 1.2600.
GBP/USD has eased in its bullish rebound, but hovering above the 1.2600 mark suggests remaining trading with a bullish trajectory. The RSI has eased to near 50 level while the MACD is flowing flat, suggesting the bullish momentum has eased.
Resistance level: 1.2660, 1.2760
Support level: 1.2540, 1.2440
The EUR/USD pair has retreated from its recent bullish momentum, encountering resistance at the 1.0866 level. The strengthening of the U.S. dollar, supported by robust job data, has exerted downward pressure on the pair. However, market focus now shifts to the upcoming interest rate decision by the European Central Bank (ECB) scheduled for this Thursday. Traders are closely monitoring the ECB’s monetary policy statement, which accompanies the interest rate decision, as it could significantly influence the direction of the pair.
EUR/USD recorded a slight retracement in the last session but remains trading with its bullish trajectory. The MACD has crossed on the above while the RSI has dropped out from the overbought zone, suggesting the bullish momentum has eased.
Resistance level: 1.0866, 1.0954
Support level: 1.0775, 1.0700
The USD/JPY pair remains confined within a narrow sideways range, fluctuating between the 151.15 and 151.75 levels. Despite this range-bound movement, a recent uptick in the dollar’s strength on Friday has prompted a modest rebound in the pair, bringing it back towards its critical levels. Meanwhile, recent data showing a slight decline in Japanese overall wage income from 2% to 1.8% suggests that the Bank of Japan (BoJ) may maintain its current monetary policy stance, particularly after its first rate hike last month.
The USD/JPY pair continues to trade in a sideways pattern awaiting the pair to pick a direction. The RSI has rebounded to above 50 level and the MACD continues to flow closely to the zero line suggest the pair is trading with minimal bullish momentum.
Resistance level: 151.85, 153.20
Support level: 149.50, 147.60
The NZD/USD pair exhibited a recovery from its prior downward trend since the start of the previous week. Nonetheless, the resurgence of the U.S. dollar on Friday posed a challenge to the pair’s ascending momentum. With the Reserve Bank of New Zealand (RBNZ) set to make its interest rate decision imminently, market projections suggest that the central bank is likely to sustain its interest rate at 5.5%. Such a decision is anticipated to bolster the strength of the New Zealand dollar.
Despite the pair having slid in the last session, the pais remain trading with its bullish trajectory. The MACD is sliding while the RSI failed to break into the overbought zone, suggesting the bullish momentum is vanishing.
Resistance level: 0.6050, 0.6100
Support level: 0.5950, 0.5895
Despite the robust jobs report, US equity markets managed to stage a recovery, with investors engaging in bargain hunting following a recent downturn. The week concluded with major stock benchmarks averting a third consecutive weekly loss. Attention now shifts to forthcoming economic data, notably the Consumer Price Index (CPI) figures for March, which are anticipated to indicate a moderation in inflationary pressures. Additionally, market participants eagerly anticipate the commencement of first-quarter earnings season to evaluate the underlying strength of major US stocks and justify recent valuation increases.
Dow Jones is trading flat while currently testing the resistance level. MACD has illustrated diminishing bearish momentum, while RSI is at 44, suggesting the index might extend its gains after breakout since the RSI rebounded sharply from oversold territory.
Resistance level: 39150.00, 39855.00
Support level: 37700.00, 36560.00
Oil prices initially surged, supported by geopolitical tensions in the Middle East and concerns over supply constraints coupled with optimistic demand forecasts. Heightened geopolitical risks, particularly the escalating conflict between Iran and Israel, fueled apprehensions of potential supply disruptions, bolstering oil prices. However, gains were short-lived as the resurgent US Dollar dampened demand for the dollar-denominated commodity, causing prices to retreat. Market focus remains on geopolitical developments and their impact on global supply dynamics.
Oil prices are trading lower following the prior retracement from the resistance level. MACD has illustrated increasing bearish momentum, while RSI is at 45, suggesting the commodity might extend its losses since the RSI breakout below the midline.
Resistance level: 85.75, 87.90
Support level: 83.05, 80.20

Giao dịch ngoại hối, chỉ số, Kim loại,...với phí chênh lệch thấp trong ngành và khớp lệnh nhanh như chớp
Đăng ký Tài khoản Live PU Prime với quy trình đơn giản của chúng tôi
Dễ dàng nạp tiền vào tài khoản của bạn với nhiều kênh nạp tiền và loại tiền tệ được chấp nhận
Truy cập hàng trăm công cụ trong điều kiện giao dịch hàng đầu thị trường