PU Prime App
Exclusive deals on mobile


PU Prime App
Exclusive deals on mobile


Nắm giữ thị trường toàn cầu trong tay bạn
Ứng dụng di động giao dịch của chúng tôi tương thích với hầu hết các thiết bị thông minh. Tải xuống Ứng dụng ngay bây giờ và bắt đầu giao dịch với PU Prime trên mọi thiết bị, mọi lúc, mọi nơi.

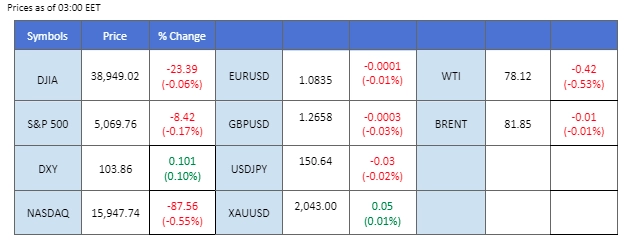
The Dollar Index underwent considerable volatility, fluctuating within a range of approximately 0.3% in the recent session.
The Dollar Index underwent considerable volatility, fluctuating within a range of approximately 0.3% in the recent session. This movement followed a mixed bag of U.S. economic data. On one hand, the last quarter’s U.S. GDP growth came in at 3.2%, falling short of market expectations. On the other hand, the GDP price index indicated a 1.7% figure, implying persistent inflationary pressures in the country. Concurrently, U.S. equity markets continued to grapple with challenges after experiencing an Artificial Intelligence (AI)-driven rally in the previous week. Traders are now closely monitoring the U.S. Personal Consumption Expenditures (PCE) reading, slated for later today, which is anticipated to wield significant influence over the equity markets.
In the realm of commodities, gold prices exhibited a consolidated pattern, trading below a robust resistance level set at $2040. Conversely, oil prices faced downward pressure due to higher-than-expected crude stockpile data, raising concerns about the demand outlook in the U.S. Furthermore, Bitcoin (BTC) achieved its highest price level, surpassing $64,000, before undergoing a correction and currently sustaining levels above $60,000. The cryptocurrency market dynamics continue to be marked by notable fluctuations and developments.
Current rate hike bets on 20th March Fed interest rate decision:
Source: CME Fedwatch Tool
0 bps (89.5%) VS -25 bps (10.5%)

(MT4 System Time)

Source: MQL5

The Dollar Index retreats slightly against major currencies, driven by disappointing US Gross Domestic Product (GDP) data, revealing a decline from 4.90% to 3.2%. Nonetheless, the Federal Reserve’s hawkish stance, articulated by New York Fed President John Williams and Atlanta Fed President Raphael Bostic, signals a commitment to maintaining a higher interest rate environment. This mixed signal prompts the Greenback to continue its consolidation. Market anticipation centres on the upcoming PCE Price Index data for further insights into inflation and interest rate trajectories.
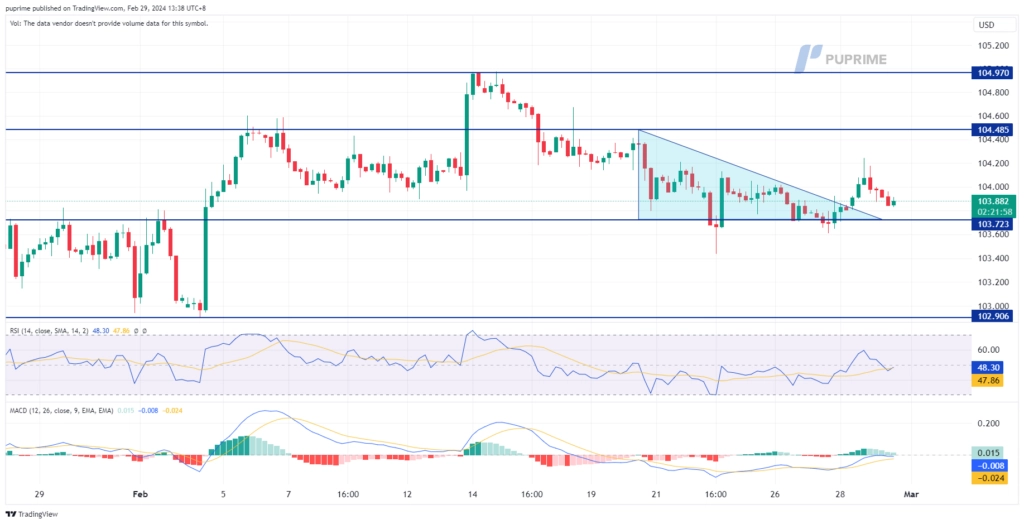
The Dollar Index is trading lower while currently testing the support level. MACD has illustrated diminishing bullish momentum, while RSI is at 50, suggesting the index might extend its losses after breakout since the RSI retreated sharply from overbought territory.
Resistance level: 104.50, 104.95
Support level: 103.70, 102.90
Gold prices rebound amid a depreciation of the US Dollar following downbeat GDP data. The overall bullish momentum in the gold market is fueled by the Greenback’s struggles. The consolidation phase persists, with market focus shifting to the upcoming US Core PCE Price Index. Investors remain vigilant, seeking cues from this crucial data to navigate the gold market.
Gold prices are trading higher while currently testing the resistance level. MACD has illustrated diminishing bearish momentum, while RSI is at 55, suggesting the commodity might extend its gains after breakout since the RSI stays above the midline.
Resistance level: 2035.00, 2060.00
Support level: 2015.00, 1985.00
The GBP/USD currency pair exhibited a technical rebound, gaining approximately 0.3% and finding support around the 1.2630 level. With a dearth of specific catalysts for the Sterling, the pair’s movements are notably influenced by dynamics within the U.S. dollar. The U.S. GDP, falling short at 3.2% compared to the previous reading of 4.9%, contributed to a weakening dollar, allowing the GBP/USD pair to experience a rebound. Traders are closely eyeing the U.S. Personal Consumption Expenditures (PCE) data scheduled for release today, which is expected to wield significant influence on the pair’s direction.
The GBP/USD pair recorded a rebound at its support level at 1.2630 but is yet to reach its recent high level, suggesting a long-term bearish momentum remains. The RSI remain hovering near the 50 level while the MACD is on the brink of breaking below the zero line, suggesting the bearish momentum remains with the pair.
Resistance level: 1.2710, 1.2785
Support level:1.2635, 1.2530
The EUR/USD pair has seen a reversal in its bearish trend, marking a gain of over 0.3% in the last session. The lower-than-expected U.S. GDP growth, released yesterday, exerted downward pressure on the strength of the dollar, leading to a technical rebound for the pair. Traders are now turning their attention to the euro’s Consumer Price Index (CPI) reading, scheduled for tomorrow, which is anticipated to wield a substantial impact on the pair’s price movement.
EUR/USD has rebounded but remains below its previous high level, suggesting the bearish bias on the pair remains. The MACD is on the brink of breaking below the zero line, while the RSI hovering at the lower zone suggests the bearish momentum remains intact with the pair.
Resistance level: 1.0865, 1.0954
Support level: 1.0775, 1.0770
The Australian dollar managed to secure a marginal gain against the U.S. dollar, following the latter’s decline triggered by disappointing GDP figures released yesterday. Nonetheless, the Australian dollar’s performance remained subdued against the U.S. dollar, weighed down by the country’s higher unemployment rate reported weeks ago and recent Retail Sales data that fell short of expectations.
The AUD/USD pair has recorded a technical rebound, but the bearish bias remains intact. The RSI remains at the lower zone while the MACD has broken below the zero line, suggesting the pair remain trading with bearish momentum.
Resistance level: 0.6535, 0.6617
Support level: 0.6484, 0.6410
The Japanese Yen strengthened, causing the USD/JPY pair to trade below the 150.80 level. Remarks by Japanese officials at the G-20 summit in Sao Paulo, expressing concerns over the Yen’s volatility, fueled speculation of a potential market intervention, sending the pair down by more than 0.5%. Additionally, the U.S. Personal Consumption Expenditures (PCE) index is under close scrutiny, with expectations that it will significantly influence the pair’s movements.
The pair has dropped out from the ascending triangle pattern, suggesting a bearish signal for the pair. The RSI is on the brink of breaking into the oversold zone while the MACD is flowing flat close to the zero line, suggesting a bearish momentum is forming.
Resistance level: 151.85, 154.90
Support level: 149.50, 147.60
Crude oil prices retreated slightly in the wake of a bearish Energy Information Administration (EIA) inventory report, revealing a notable increase from 3.514M to 4.199M, surpassing market expectations. US stockpiles rose for the fifth consecutive week due to unplanned refinery outages post a winter storm. However, losses are contained as analysts anticipate OPEC+ may consider extending voluntary oil output cuts into the second quarter, providing a mitigating factor for oil prices.
Oil prices are trading lower following the prior retracement from the resistance level. MACD has illustrated diminishing bullish momentum, while RSI is at 52, suggesting the commodity might extend its losses since the RSI retreated sharply from overbought territory.
Resistance level: 78.65, 81.20
Support level: 75.20, 71.35

Giao dịch ngoại hối, chỉ số, Kim loại,...với phí chênh lệch thấp trong ngành và khớp lệnh nhanh như chớp
Đăng ký Tài khoản Live PU Prime với quy trình đơn giản của chúng tôi
Dễ dàng nạp tiền vào tài khoản của bạn với nhiều kênh nạp tiền và loại tiền tệ được chấp nhận
Truy cập hàng trăm công cụ trong điều kiện giao dịch hàng đầu thị trường