PU Prime App
Exclusive deals on mobile


PU Prime App
Exclusive deals on mobile


Nắm giữ thị trường toàn cầu trong tay bạn
Ứng dụng di động giao dịch của chúng tôi tương thích với hầu hết các thiết bị thông minh. Tải xuống Ứng dụng ngay bây giờ và bắt đầu giao dịch với PU Prime trên mọi thiết bị, mọi lúc, mọi nơi.

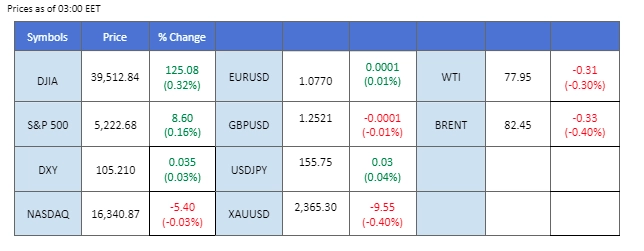
On Friday, the U.S. dollar remained stagnant after being affected by positive initial jobless claims data, which hinted at an easing job market and potential measures from the Fed to curb inflation. U.S. equity markets continued their upward trajectory in anticipation of a more accommodative monetary policy from the Fed in the near term. In Hong Kong, the equity index surpassed the 19,000 mark following reports that China plans to issue its first batch of ultra-long bonds to stimulate the economy. However, the Chinese Consumer Price Index (CPI) released on Saturday fell below expectations, causing oil prices to decline to recent lows when the market opened today. Additionally, Japanese authorities reduced their bond purchases in regular operations in response to the significant depreciation of the yen.
Current rate hike bets on 12nd June Fed interest rate decision:
Source: CME Fedwatch Tool
0 bps (91.5%) VS -25 bps (8.5%)

(MT4 System Time)
N/A
Source: MQL5
The Dollar Index, gauging the greenback against a basket of major currencies, saw a decline as investors steered clear of the US market ahead of pivotal events this week. Lingering concerns over disappointing US economic indicators, such as the Nonfarm Payrolls and Unemployment Rate, coupled with the Federal Reserve’s decision to maintain interest rates, fueled apprehensions. Market sentiment now hinges on forthcoming economic data, with Fed members signalling a data-dependent approach before considering interest rate adjustments.
The Dollar Index is trading lower while currently near the support level. MACD has illustrated increasing bearish momentum, while RSI is at 49, suggesting the index might extend its losses since the RSI stays below the midline.
Resistance level: 105.85, 106.35
Support level: 105.05, 104.75
Gold prices retraced marginally following a notable surge, driven primarily by technical corrections and profit-taking. However, the overarching bullish sentiment for gold persisted, fueled by disappointing US economic data that underscored its safe-haven appeal. Additionally, escalating US-China trade tensions contributed to heightened demand for gold. President Joe Biden’s indication of potential tariff increases on Chinese electric vehicles added to market jitters, underscoring gold’s role as a hedge against geopolitical uncertainties.
Gold prices are trading lower following the prior retracement from the resistance level. MACD has illustrated increasing bearish momentum, while RSI is at 57, suggesting the commodity might extend its losses since the RSI retreated sharply from overbought territory.
Resistance level: 2375.00, 2405.00
Support level: 2350.00, 2325.00
The GBP/USD pair has shown some resilience, finding support near the 1.2470 level and subsequently achieving a modest increase. It is currently facing a strong resistance around the 1.2540 mark. This positive movement was bolstered by last Friday’s encouraging GDP data from the UK, which reported a growth of 0.6%, a significant improvement from the previous -0.3%. Market participants are now focusing on the upcoming U.S. Producer Price Index (PPI) data, which is expected to influence the direction of the pair.
GBP/USD has eased in bearish momentum and recorded a marginal gain but faced resistance at 1.2540. The RSI hovering near the 50 level while the MACD is on the brink of breaking above the zero line suggests that bullish momentum is forming.
Resistance level: 1.2540, 1.2610
Support level: 1.2440, 1.2375
The EUR/USD pair has experienced a recent uplift, reaching close to the 1.0780 mark, primarily driven by a weakening U.S. dollar despite repeated affirmations from various Federal Reserve officials that achieving a 2% inflation target remains a central objective. Meanwhile, insights from the latest ECB Account of the Monetary Policy Meeting reveal a positive outlook among ECB board members regarding progress in controlling inflation. This development has led to anticipations that discussions on potential rate cuts could occur as soon as June.
The pair is currently facing a strong resistance level after rebounding from the 1.0730 level. The MACD shows signs of rebounding from above the zero line, while the RSI remains flowing at above 50, suggesting the pair is still trading with bullish momentum.
Resistance level:1.0865, 1.0940
Support level: 1.0700, 1.0630
US equity markets continued their upward trajectory, buoyed by diminishing US Treasury yields and growing anticipation of Fed rate cuts. However, amidst the bullish momentum, caution looms as uncertainties persist ahead of crucial US inflation data and escalating US-China trade tensions. Investors remain vigilant for signals from these developments that could sway market sentiment.
The Dow Jones is trading higher while currently near the resistance level. However, MACD has illustrated diminishing bullish momentum, while RSI is at 74, suggesting the index might enter overbought territory.
Resistance level: 39850.00, 41000.00
Support level: 39145.00, 37690.00
The USD/JPY pair has exhibited minimal movement recently, maintaining a narrow trading range following its rebound from around the 152.00 level. Despite this, the yen has been under pressure, prompting action from Japanese authorities to reduce the scale of bond purchases during regular operations. This strategic move aims to bolster bond yields, potentially contributing to a resurgence in the strength of the yen.
The pair is trading in an extreme sideways manner and is awaiting a catalyst to pick a direction. The RSI is flowing in the upper region while the MACD remains above the zero line, suggesting that the bullish momentum is intact with the pair.
Resistance level: 156.90, 158.35
Support level: 154.30, 153.30
Oil prices experienced a downturn in anticipation of the OPEC+ meeting on supply policy, exacerbated by conflicting statements from Iraq regarding production cuts. Initially asserting production sufficiency, Iraqi Oil Minister Hayyan Abdul Ghani later deferred decisions to OPEC, injecting uncertainty into the market. Despite hopes of a Middle East ceasefire dampening supply disruption fears, attention remains fixed on the outcomes of the OPEC+ deliberations and geopolitical developments.
Oil prices are trading lower while currently testing the support level. MACD has illustrated increasing bearish momentum, while RSI is at 38, suggesting the commodity might extend its losses after breakout since the RSI stays below the midline.
Resistance level: 80.40, 81.90
Support level: 78.00, 75.95

Giao dịch ngoại hối, chỉ số, Kim loại,...với phí chênh lệch thấp trong ngành và khớp lệnh nhanh như chớp
Đăng ký Tài khoản Live PU Prime với quy trình đơn giản của chúng tôi
Dễ dàng nạp tiền vào tài khoản của bạn với nhiều kênh nạp tiền và loại tiền tệ được chấp nhận
Truy cập hàng trăm công cụ trong điều kiện giao dịch hàng đầu thị trường